

Audi Coupe B3
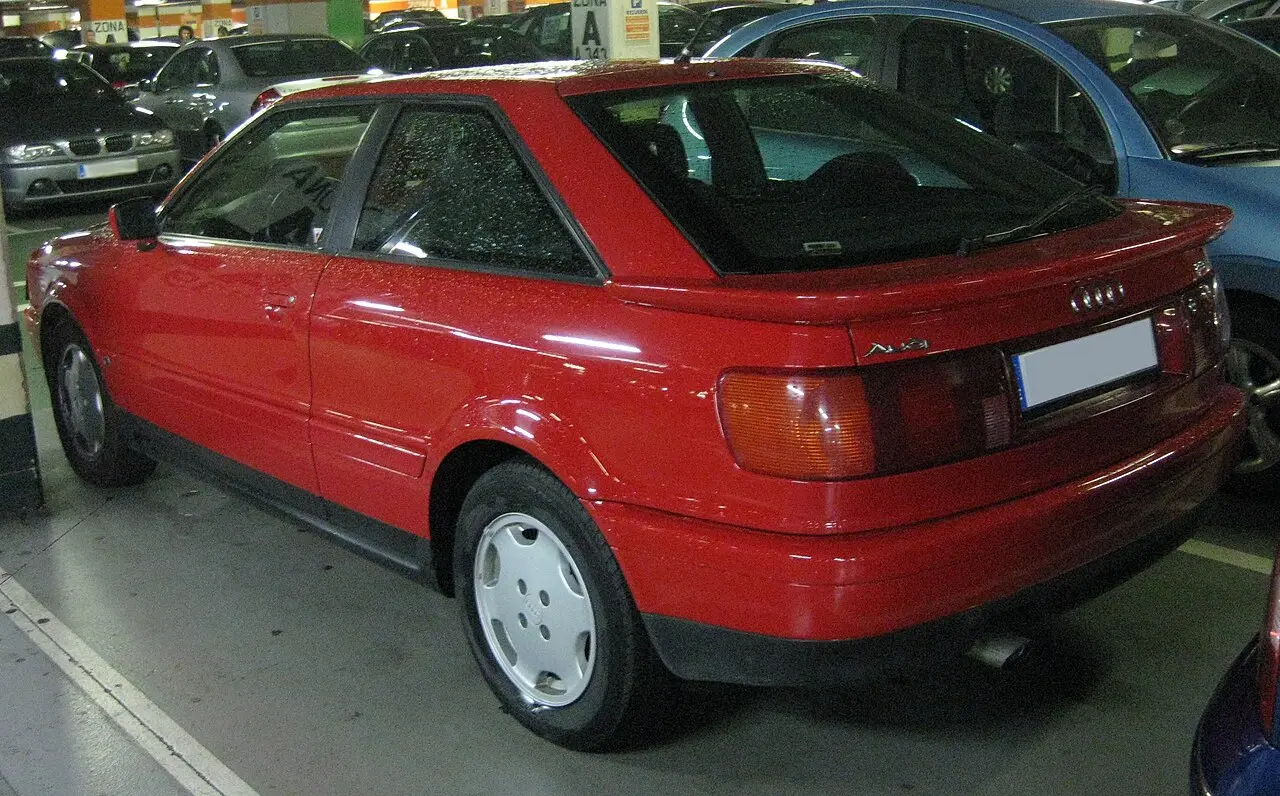
The Audi Coupe B3 (1988–1991): dimensions, weights, reliability and the official figures of its 1 version in the United States.
Model codes: 89, 8B · Sold in: European Union, United States, Canada, United Kingdom, and France
Dimensions, weights and capacity
| Specification | Europe | North America | Wikipedia |
|---|---|---|---|
| Dimensions | |||
| Length | 4,400 mm RDW | – | 4,366 mm |
| Width | 1,720 mm RDW | – | 1,716 mm |
| Height | 1,370 mm RDW | – | 1,355 mm |
| Wheelbase | 2,530–2,550 mm RDW | – | 2,555 mm |
| Weights and towing | |||
| Kerb weight | 1,100–1,320 kg RDW | – | 1,170–1,400 kg |
| Mass in running order | 1,200–1,420 kg RDW | – | – |
| Gross vehicle weight | 1,660–1,880 kg RDW | – | – |
| Towing, braked trailer | 1,400–1,500 kg RDW | – | – |
| Towing, unbraked trailer | 600–640 kg RDW | – | – |
| Seats and space | |||
| Seats | 5 RDW | – | – |
| Doors | 2 RDW | – | – |
| Luggage space (EPA) | – | 396 L EPA | – |
| Passenger space (EPA) | – | 2,124 L EPA | – |
| Performance | |||
| Top speed | 206 km/h RDW | – | – |
Ranges cover the generation’s versions and body styles; European and North American versions can differ. Sources: RDW type approvals (Netherlands), Wikipedia, US EPA fuel economy data. Wikipedia figures are used under CC BY-SA 4.0.
Reliability and owner reports
Owner complaints to NHTSA (US)
2 complaints for model years 1990–1990.
Complaints are reported by owners and not checked by NHTSA; they are not adjusted for how many cars were sold, so popular models have more. NHTSA owner complaints
The Audi Coupe B3’s 1 version
United States 1 version
Model years sold in the USA, from the EPA and the Department of Energy (fueleconomy.gov). MPG on the EPA test; litres per 100 km = 235.215 ÷ MPG.
| Years and version | Engine | Fuel | Gearbox | Drive | Consumption (combined) | CO₂ |
|---|---|---|---|---|---|---|
| 1990–1991(20-VALVE) (FFS) | 2.3 L | Petrol | 5-speed manual | Four- or all-wheel drive | 18 MPG (13.1 L/100 km) EPA | 307 g/km |
Similar models from other brands






Official figures are measured on standard test procedures and differ between markets. Your consumption depends on how, where and in what conditions you drive.