

Mitsubishi Lancer eighth generation
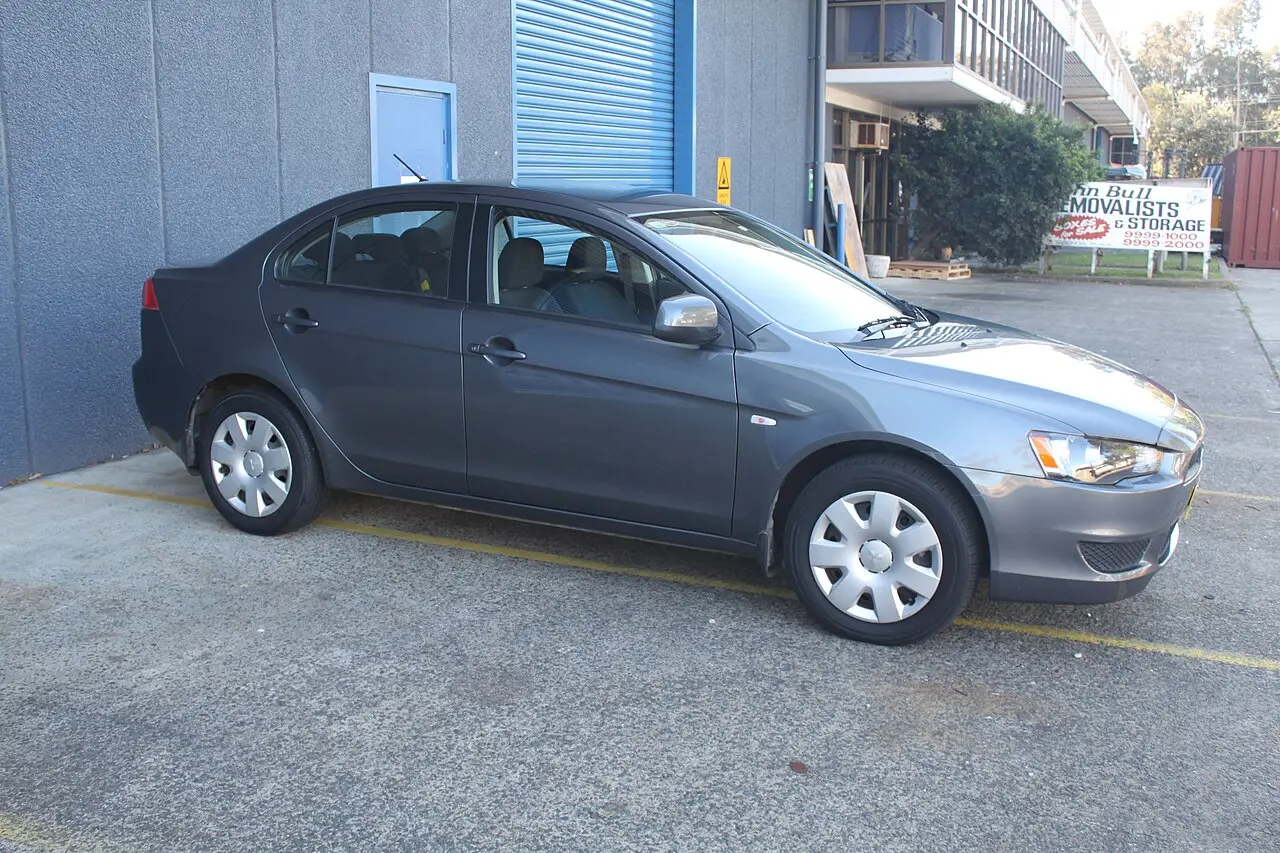
The Mitsubishi Lancer eighth generation (2007–2017): dimensions, weights, reliability and the official figures of its 64 versions in the European Union, the United Kingdom, the United States, and Canada.
Model codes: CY, CX · Sold in: European Union, United Kingdom, United States, and Canada
Dimensions, weights and capacity
| Specification | Europe | North America | Wikipedia |
|---|---|---|---|
| Dimensions | |||
| Length | 4,570–4,590 mm RDW | 4,570–4,640 mm TC | 4,495–4,605 mm |
| Width | 1,760 mm RDW | 1,760 mm TC | 1,695 mm |
| Height | 1,480–1,510 mm RDW | 1,480–1,510 mm TC | 1,375–1,425 mm |
| Wheelbase | 2,600–2,640 mm RDW | 2,640 mm TC | 2,600 mm |
| Front track | 1,530 mm ASTRA | 1,530 mm TC | – |
| Rear track | 1,530 mm ASTRA | 1,520–1,530 mm TC | – |
| Weights and towing | |||
| Kerb weight | 1,205–1,330 kg RDW | 1,310–1,570 kg TC | 1,399 kg |
| Mass in running order | 1,305–1,430 kg RDW | – | – |
| Gross vehicle weight | 1,750–1,900 kg RDW | – | – |
| Towing, braked trailer | 1,100–1,300 kg RDW | – | – |
| Towing, unbraked trailer | 400–550 kg RDW | – | – |
| Seats and space | |||
| Seats | 5 RDW | – | – |
| Doors | 4 RDW | – | – |
| Luggage space (EPA) | – | 283–396 L EPA | – |
| Passenger space (EPA) | – | 2,633–2,690 L EPA | – |
| Performance | |||
| Top speed | 181–204 km/h RDW | – | – |
| Torque | 143–343 Nm ASTRA | – | – |
Tyre sizes (most common first): 205/60R16, 215/45R18
NHTSA overall safety rating (US): 2012–2017: ★★★★☆
Ranges cover the generation’s versions and body styles; European and North American versions can differ. Sources: RDW type approvals (Netherlands), Transport Canada vehicle specifications, Wikipedia (en, de), ASTRA type approvals (Switzerland), US EPA fuel economy data, Traficom type approvals (Finland), NHTSA 5-Star Safety Ratings. Wikipedia figures are used under CC BY-SA 4.0.
Reliability and owner reports
UK MOT: first-time pass rate by age
| Age at test | Pass rate | UK average | Tests |
|---|---|---|---|
| 9–12 years | 70.2% (68.9–71.6) | 77.9% | 4,541 |
| 13 years and older | 69.8% (69.0–70.7) | 69.2% | 11,827 |
What the MOT finds
| Area | This model | UK average, same ages |
|---|---|---|
| Suspension | 41.3% | 37.6% |
| Brakes | 40.4% | 33.9% |
| Tyres | 29.9% | 31.2% |
| Lights and electrics | 27.2% | 25.7% |
| Body, chassis and structure | 16.0% | 15.6% |
| Steering | 15.6% | 6.8% |
First MOT test of each car per year in 2022–2024, from the DVSA’s anonymised test results; only ages with at least 500 tests are shown. The figure in brackets is the 95% confidence interval; green or red means clearly above or below the UK average. The second table shows how often an item was noted (defect or advisory) in each area, against the UK average for cars of the same ages. DVSA anonymised MOT tests (Open Government Licence)
Owner complaints to NHTSA (US)
418 complaints for model years 2008–2017. 38 crashes · 8 fires · 29 injuries
- Transmission and drivetrain 103
- Engine 92
- Electrical system 49
- Airbags 35
- Suspension 31
- Steering 27
Complaints are reported by owners and not checked by NHTSA; they are not adjusted for how many cars were sold, so popular models have more. NHTSA owner complaints
All 64 versions of the Mitsubishi Lancer eighth generation
Show all 64 versions
European Union 28 versions
New cars registered in the EU (plus Norway and Iceland), from the European Environment Agency. Figures on the NEDC procedure until 2020 and on WLTP from 2021; versions are grouped by engine and power, with their number of registrations.
| Years and version | Engine | Power | Fuel | CO₂ | EU registrations |
|---|---|---|---|---|---|
| 2011–2018 | 1.6 L | 86 kW (117 PS) | Petrol | 130–133 g/km | 33,089 |
| 2011–2018 | 1.8 L | 103 kW (140 PS) | Petrol | 149–167 g/km | 5,906 |
| 2011–2017 | 1.6 L | 85 kW (116 PS) | Petrol | 128–132 g/km | 1,833 |
| 2012–2016 | 1.6 L | 86 kW (117 PS) | LPG | 107–133 g/km | 900 |
| 2011–2016 | 1.8 L | 85 kW (116 PS) | Diesel | 126–142 g/km | 3,517 |
| 2011–2015 | 1.8 L | 110 kW (150 PS) | Diesel | 135–143 g/km | 3,522 |
| 2011–2014 | 2.0 L | 217 kW (295 PS) | Petrol | 241–244 g/km | 212 |
| 2010–2013 | – | – | Petrol | 147–165 g/km | 2,828 |
| 2011–2012 | 1.8 L | 103 kW (140 PS) | LPG | 155–172 g/km | 250 |
| 2011–2012 | 2.0 L | 177 kW (241 PS) | Petrol | 232–233 g/km | 349 |
| 2011–2012 | 1.8 L | 105 kW (143 PS) | Petrol | 175–187 g/km | 810 |
| 2011 | 2.0 L | 103 kW (140 PS) | Diesel | 167 g/km | 3,518 |
| 2011 | 1.5 L | 80 kW (109 PS) | Petrol | 145 g/km | 1,826 |
| 2011 | 1.5 L | 79 kW (107 PS) | LPG | 137 g/km | 50 |
| 2011 | 1.8 L | 100 kW (136 PS) | Diesel | 150 g/km | 18 |
| 2011 | 1.6 L | 72 kW (98 PS) | Petrol | 163 g/km | 12 |
| 2010 | 1.8 L | – | Petrol | 181 g/km | 11,404 |
| 2010 | 1.5 L | – | Petrol | 150 g/km | 9,618 |
| 2010 | 2.0 L | – | Diesel | 165 g/km | 8,242 |
| 2010 | 1.6 L | – | Petrol | 133 g/km | 2,126 |
| 2010 | 2.0 L | – | Petrol | 239 g/km | 916 |
| 2010 | 1.8 L | – | Diesel | 142 g/km | 764 |
| 2010 | 1.8 L | – | LPG | 180 g/km | 256 |
| 2010 | – | – | Other fuel | 182 g/km | 218 |
| 2010 | 1.8 L | – | Flex fuel (E85) | 167 g/km | 136 |
| 2010 | 1.6 L | – | Petrol | 163 g/km | 130 |
| 2010 | 1.5 L | – | LPG | 137 g/km | 108 |
| 2010 | 2.0 L | – | Petrol | 207 g/km | 16 |
United Kingdom 10 versions
New cars on sale in the UK, from the Vehicle Certification Agency. NEDC figures until 2018 and WLTP figures after; years are the editions a version appeared in.
| Years and version | Engine | Fuel | Gearbox | Consumption (combined) | CO₂ |
|---|---|---|---|---|---|
| 2010SE 1.5 | 1.5 L | Petrol | 5-speed manual | 6.4 L/100 km NEDC | 153 g/km |
| 2010GS2 1.5 | 1.5 L | Petrol | 5-speed manual | 6.6 L/100 km NEDC | 156 g/km |
| 2008–2010GS3 · GS4 | 1.8 L | Petrol | 5-speed manual | 7.7 L/100 km NEDC | 183 g/km |
| 2008–2010GS3 · GS4 | 1.8 L | Petrol | Continuously variable (CVT) | 7.9–8.3 L/100 km NEDC | 188–198 g/km |
| 2010GS2 1.8 · GS3 · GS4 | 1.8 L | Petrol | 5-speed manual | 7.9 L/100 km NEDC | 188 g/km |
| 2010GS2 1.8 | 1.8 L | Petrol | Continuously variable (CVT) | 8.0 L/100 km NEDC | 191 g/km |
| 2008–2010GS3 · GS4 · GS2 2.0 | 2.0 L | Diesel | 6-speed manual | 6.3 L/100 km NEDC | 165 g/km |
| 2010GS3 with DPF · GS4 with DPF | 2.0 L | Diesel | 6-speed manual | 6.4 L/100 km NEDC | 169–173 g/km |
| 2010GS3 · GS4 | 2.0 L | Diesel | 6-speed manual | 6.5 L/100 km NEDC | 170 g/km |
| 2010GS · GSR | 2.0 L | Petrol | Automatic | 10.2 L/100 km NEDC | 243 g/km |
United States 12 versions
Model years sold in the USA, from the EPA and the Department of Energy (fueleconomy.gov). MPG on the EPA test; litres per 100 km = 235.215 ÷ MPG.
| Years and version | Engine | Fuel | Gearbox | Drive | Consumption (combined) | CO₂ |
|---|---|---|---|---|---|---|
| 2010–2017 | 2.0 L | Petrol | 5-speed manual | Front-wheel drive | 25–28 MPG (8.4–9.4 L/100 km) EPA | 197–221 g/km |
| 2010–2017 | 2.0 L | Petrol | Continuously variable (CVT) | Front-wheel drive | 26–30 MPG (7.8–9.0 L/100 km) EPA | 183–212 g/km |
| 2012–2017 | 2.4 L | Petrol | Continuously variable (CVT) | All-wheel drive | 25–26 MPG (9.0–9.4 L/100 km) EPA | 209–224 g/km |
| 2010–2016 | 2.4 L | Petrol | 5-speed manual | Front-wheel drive | 23–25 MPG (9.4–10.2 L/100 km) EPA | 217–240 g/km |
| 2010–2016 | 2.4 L | Petrol | Continuously variable (CVT) | Front-wheel drive | 25–26 MPG (9.0–9.4 L/100 km) EPA | 206–224 g/km |
| 2011–2015 | 2.0 L | Petrol | 6-speed automated manual | All-wheel drive | 20 MPG (11.8 L/100 km) EPA | 272–276 g/km |
| 2010PR | 2.0 L | Petrol | 6-speed automated manual | All-wheel drive | 20 MPG (11.8 L/100 km) EPA | 276 g/km |
| 2009–2010DOHC, VMODE VLKUP | 2.4 L | Petrol | Continuously variable (CVT) | Front-wheel drive | 23 MPG (10.2 L/100 km) EPA | 240 g/km |
| 2009–2010DOHC | 2.4 L | Petrol | 5-speed manual | Front-wheel drive | 22–23 MPG (10.2–10.7 L/100 km) EPA | 240–251 g/km |
| 2008–2009DOHC, VMODE VLKUP | 2.0 L | Petrol | Continuously variable (CVT) | Front-wheel drive | 24 MPG (9.8 L/100 km) EPA | 230 g/km |
| 2008–2009DOHC | 2.0 L | Petrol | 5-speed manual | Front-wheel drive | 24–25 MPG (9.4–9.8 L/100 km) EPA | 221–230 g/km |
| 2009DOHC TURBO, 2MODE CLKUP | 2.0 L | Petrol | 6-speed automatic | Four- or all-wheel drive | 20 MPG (11.8 L/100 km) EPA | 276 g/km |
Canada 14 versions
Model years sold in Canada, from Natural Resources Canada fuel consumption ratings (5-cycle test).
| Years and version | Engine | Fuel | Gearbox | Consumption (combined) | CO₂ |
|---|---|---|---|---|---|
| 2008–2017Compact | 2.0 L | Petrol | Continuously variable (CVT) | 7.8–9.7 L/100 km 5-cycle | 181–223 g/km |
| 2008–2017Compact | 2.0 L | Petrol | 5-speed manual | 8.3–9.8 L/100 km 5-cycle | 191–225 g/km |
| 2011–2017Station wagon: Small | 2.0 L | Petrol | Continuously variable (CVT) | 8.3–8.7 L/100 km 5-cycle | 191–200 g/km |
| 2011–2017Station wagon: Small | 2.0 L | Petrol | 5-speed manual | 8.6–8.7 L/100 km 5-cycle | 198–205 g/km |
| 2012–2017Compact | 2.4 L | Petrol | Continuously variable (CVT) | 8.8–9.5 L/100 km 5-cycle | 204–219 g/km |
| 2009–2017Compact | 2.4 L | Petrol | 5-speed manual | 9.2–10.1 L/100 km 5-cycle | 217–232 g/km |
| 2013–2015Compact | 2.0 L | Petrol | 6-speed automated manual | 11.6 L/100 km 5-cycle | 267 g/km |
| 2011–2012Compact · Station wagon: Small | 2.0 L | Petrol | 6-speed automatic | 11.6 L/100 km 5-cycle | 267 g/km |
| 2012Compact · Station wagon: Small | 2.0 L | Petrol | 5-speed manual | 8.5 L/100 km 5-cycle | 196 g/km |
| 2009–2010Station wagon: Small · Compact | 2.0 L | Petrol | 6-speed automatic | 11.8 L/100 km 5-cycle | 271 g/km |
| 2009–2010Compact · Station wagon: Small | 2.4 L | Petrol | Continuously variable (CVT) | 9.8–10.2 L/100 km 5-cycle | 225–235 g/km |
| 2010Compact · Station wagon: Small | 2.4 L | Petrol | 5-speed manual | 10.3 L/100 km 5-cycle | 237 g/km |
| 2009Compact | 2.0 L | Petrol | 6-speed automatic | 11.8 L/100 km 5-cycle | 271 g/km |
| 2009Station wagon: Small | 2.4 L | Petrol | 5-speed manual | 10.5 L/100 km 5-cycle | 242 g/km |
Similar models from other brands
Official figures are measured on standard test procedures and differ between markets. Your consumption depends on how, where and in what conditions you drive.