

Ford Fusion first generation
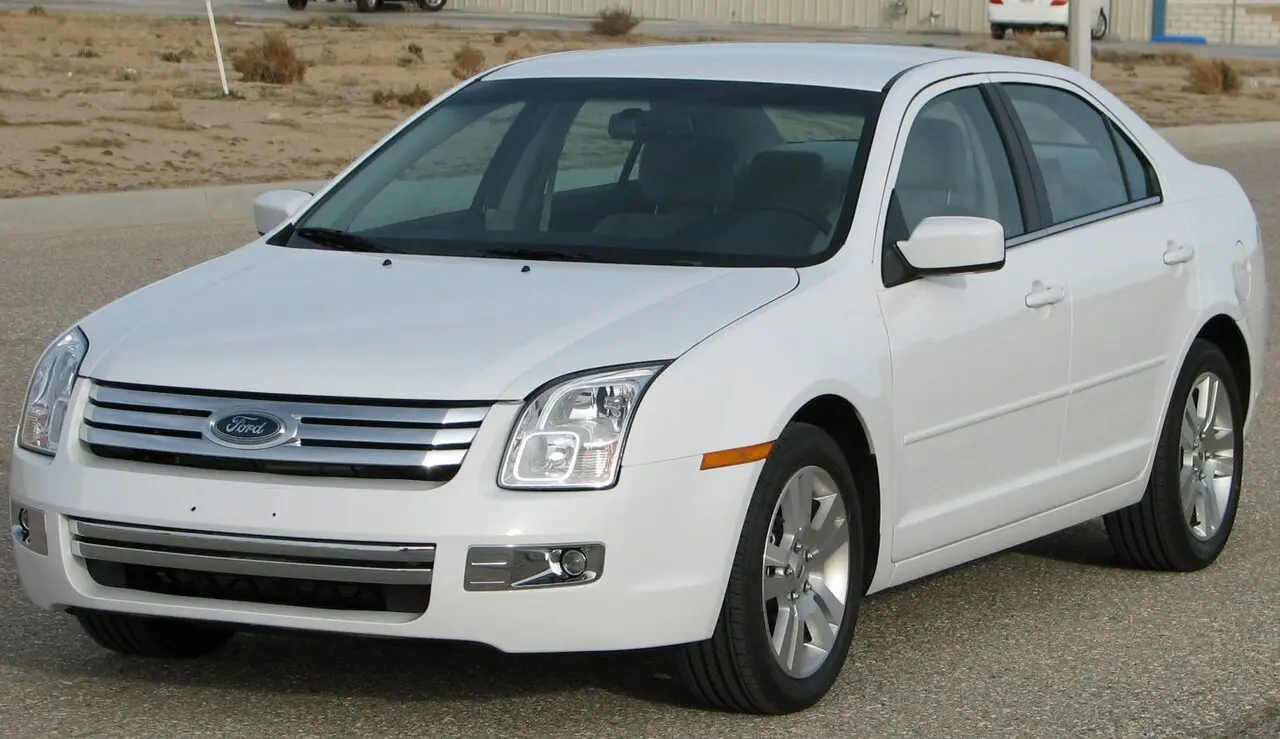
The Ford Fusion first generation (2006–2012): dimensions, weights, reliability and the official figures of its 21 versions in the United States and Canada.
Model codes: CD3 · Sold in: United States and Canada
Dimensions, weights and capacity
| Specification | Europe | North America | Wikipedia |
|---|---|---|---|
| Dimensions | |||
| Length | 4,010–4,020 mm RDW | – | – |
| Width | 1,720 mm RDW | 1,830 mm TC | 1,834 mm |
| Height | 1,540 mm RDW | 1,450 mm TC | 1,445–1,453 mm |
| Wheelbase | 2,490 mm RDW | 2,730 mm TC | 2,728 mm |
| Front track | 1,474–1,487 mm ASTRA | 1,560 mm TC | – |
| Rear track | 1,434–1,445 mm ASTRA | 1,550 mm TC | – |
| Weights and towing | |||
| Kerb weight | 1,034–1,066 kg RDW | 1,490–1,650 kg TC | – |
| Mass in running order | 1,134–1,166 kg RDW | – | – |
| Gross vehicle weight | 1,605–1,630 kg RDW | – | – |
| Towing, braked trailer | 750–900 kg RDW | – | – |
| Towing, unbraked trailer | 500 kg RDW | – | – |
| Seats and space | |||
| Seats | 5 RDW | – | – |
| Doors | 4 RDW | – | – |
| Luggage space (EPA) | – | 453 L EPA | – |
| Passenger space (EPA) | – | 2,832–2,860 L EPA | – |
| Performance | |||
| Top speed | 163–178 km/h RDW | – | – |
| Torque | 124–204 Nm ASTRA | – | – |
Tyre sizes (most common first): 185/60R14, 195/60R15, 195/55R16
NHTSA overall safety rating (US): 2011–2012: ★★★★☆
Ranges cover the generation’s versions and body styles; European and North American versions can differ. Sources: RDW type approvals (Netherlands), Transport Canada vehicle specifications, Wikipedia, ASTRA type approvals (Switzerland), US EPA fuel economy data, Traficom type approvals (Finland), NHTSA 5-Star Safety Ratings. Wikipedia figures are used under CC BY-SA 4.0.
Reliability and owner reports
UK MOT: first-time pass rate by age
| Age at test | Pass rate | UK average | Tests |
|---|---|---|---|
| 9–12 years | 82.9% (82.2–83.6) | 77.9% | 12,078 |
| 13 years and older | 71.7% (71.4–71.9) | 69.2% | 139,435 |
What the MOT finds
| Area | This model | UK average, same ages |
|---|---|---|
| Brakes | 42.6% | 35.7% |
| Suspension | 35.2% | 40.4% |
| Lights and electrics | 34.5% | 27.9% |
| Tyres | 34.3% | 31.2% |
| Noise, emissions and leaks | 15.3% | 16.4% |
| Body, chassis and structure | 14.8% | 17.7% |
First MOT test of each car per year in 2022–2024, from the DVSA’s anonymised test results; only ages with at least 500 tests are shown. The figure in brackets is the 95% confidence interval; green or red means clearly above or below the UK average. The second table shows how often an item was noted (defect or advisory) in each area, against the UK average for cars of the same ages. DVSA anonymised MOT tests (Open Government Licence)
Owner complaints to NHTSA (US)
15,324 complaints for model years 2006–2012. 539 crashes · 48 fires · 348 injuries · 8 deaths
- Steering 4,741
- Airbags 3,440
- Brakes 2,090
- Transmission and drivetrain 1,556
- Engine 1,325
- Speed control 1,292
Complaints are reported by owners and not checked by NHTSA; they are not adjusted for how many cars were sold, so popular models have more. NHTSA owner complaints
All 21 versions of the Ford Fusion first generation
Show all 21 versions
United States 13 versions
Model years sold in the USA, from the EPA and the Department of Energy (fueleconomy.gov). MPG on the EPA test; litres per 100 km = 235.215 ÷ MPG.
| Years and version | Engine | Fuel | Gearbox | Drive | Consumption (combined) | CO₂ |
|---|---|---|---|---|---|---|
| 2010–2012 | 2.5 L | Petrol | 6-speed manual | Front-wheel drive | 24–25 MPG (9.4–9.8 L/100 km) EPA | 221–230 g/km |
| 2010–2012 | 2.5 L | Petrol | 6-speed automatic | Front-wheel drive | 24–27 MPG (8.7–9.8 L/100 km) EPA | 205–230 g/km |
| 2010–2012 | 2.5 L | Hybrid | Continuously variable (CVT) | Front-wheel drive | 38–39 MPG (6.0–6.2 L/100 km) EPA | 142–145 g/km |
| 2011–2012FFV | 3.0 L | Flex fuel (E85) | 6-speed automatic | All-wheel drive | 20 MPG (11.8 L/100 km) EPA | 276 g/km |
| 2011–2012FFV | 3.0 L | Flex fuel (E85) | 6-speed automatic | Front-wheel drive | 23 MPG (10.2 L/100 km) EPA | 240 g/km |
| 2010–2012 | 3.5 L | Petrol | 6-speed automatic | All-wheel drive | 19 MPG (12.4 L/100 km) EPA | 291 g/km |
| 2010–2012 | 3.5 L | Petrol | 6-speed automatic | Front-wheel drive | 21 MPG (11.2 L/100 km) EPA | 263 g/km |
| 2010 | 3.0 L | Flex fuel (E85) | 6-speed automatic | All-wheel drive | 21 MPG (11.2 L/100 km) EPA | 263 g/km |
| 2010 | 3.0 L | Flex fuel (E85) | 6-speed automatic | Front-wheel drive | 22 MPG (10.7 L/100 km) EPA | 251 g/km |
| 2006–2009 | 2.3 L | Petrol | 5-speed manual | Front-wheel drive | 23 MPG (10.2 L/100 km) EPA | 240 g/km |
| 2006–2009CLKUP | 2.3 L | Petrol | 5-speed automatic | Front-wheel drive | 23–24 MPG (9.8–10.2 L/100 km) EPA | 230–240 g/km |
| 2006–2009CLKUP | 3.0 L | Petrol | 6-speed automatic | Front-wheel drive | 21 MPG (11.2 L/100 km) EPA | 263 g/km |
| 2007–2009CLKUP | 3.0 L | Petrol | 6-speed automatic | Four- or all-wheel drive | 19–20 MPG (11.8–12.4 L/100 km) EPA | 276–291 g/km |
Canada 8 versions
Model years sold in Canada, from Natural Resources Canada fuel consumption ratings (5-cycle test).
| Years and version | Engine | Fuel | Gearbox | Consumption (combined) | CO₂ |
|---|---|---|---|---|---|
| 2010–2012Mid-size | 2.5 L | Petrol | 6-speed manual | 9.3–9.6 L/100 km 5-cycle | 214–221 g/km |
| 2010–2012Mid-size | 2.5 L | Petrol | Continuously variable (CVT) | 6.0 L/100 km 5-cycle | 138 g/km |
| 2010–2012Mid-size | 2.5 L | Petrol | 6-speed automatic | 8.8–9.5 L/100 km 5-cycle | 202–219 g/km |
| 2006–2012Mid-size | 3.0 L | Petrol | 6-speed automatic | 10.4–12.2 L/100 km 5-cycle | 239–281 g/km |
| 2010–2012Mid-size | 3.0 L | Flex fuel (E85) | 6-speed automatic | 14.2–15.7 L/100 km 5-cycle | 227–251 g/km |
| 2010–2012Mid-size | 3.5 L | Petrol | 6-speed automatic | 11.9–12.3 L/100 km 5-cycle | 274–283 g/km |
| 2006–2009Mid-size | 2.3 L | Petrol | 5-speed manual | 10.0–10.1 L/100 km 5-cycle | 230–232 g/km |
| 2006–2009Mid-size | 2.3 L | Petrol | 5-speed automatic | 9.9–10.1 L/100 km 5-cycle | 228–232 g/km |
Similar models from other brands



Official figures are measured on standard test procedures and differ between markets. Your consumption depends on how, where and in what conditions you drive.